
Debugging in Shakespeare
When things don't work as expected, advanced troubleshooting techniques help you identify issues, gather evidence, and communicate problems effectively to get your Shakespeare projects back on track.
When building complex applications with Shakespeare, things don't always work as expected. This guide teaches you systematic debugging approaches that go beyond basic prompting, helping you identify issues, gather evidence, and communicate problems effectively to get your projects back on track.
🔧 Table of Contents
1. Debugging in Shakespeare
Effective debugging with Shakespeare starts with understanding its capabilities and limitations. Shakespeare is a powerful AI assistant for development, but knowing what it can and cannot see is crucial for getting the help you need.
What Shakespeare Can and Cannot See
✅ Shakespeare CAN See
❌ Shakespeare CANNOT See
When Shakespeare cannot see something on it's own, it's up to you to provide that information to the AI so it can use it to help you solve the bug.
📸 New: Image Upload Support - Shakespeare can now view and process images that you upload directly into the chat (not image links). This is especially helpful for sharing screenshots of errors, design references, or UI issues. Note that vision capabilities require supported AI models (like Claude Sonnet 4 or GPT-4 Vision).
How to Talk to Shakespeare About Debugging
Use the "Expectation vs. Reality" format:
- What you expect to happen: "When I click the submit button, the form should create a nostr event and submit it to the relays, then show a success message"
- What actually happens: "The button click does nothing, I dont see any nostr event coming through, nor a success message"
Good Debugging Request Example:
"My login form isn't working. EXPECTED: After entering email/password and clicking 'Login', user should be authenticated and redirected to dashboard. ACTUAL: Form submits but page just refreshes, no redirect happens. Console shows no errors. Please work with precision to fix this bug, without impacting existing features or functionality."
💡 Pro Tip: Use This Phrase
End your debugging requests with: "Work with precision to fix this bug, without impacting existing features or functionality." This prompts Shakespeare to make targeted fixes rather than broad changes.
Choosing the Right AI Model for Debugging
Shakespeare gives you the freedom to choose your model, but what you pay for is what you get! If you choose a cheap model, you can expect cheap results. Model selection significantly impacts debugging effectiveness, especially for complex applications. We highly recommend using advanced models for debugging and complex applications.
2. The Debug Hierarchy
Effective debugging follows a systematic approach. Instead of randomly trying different solutions, follow this hierarchy to identify and resolve issues efficiently.
The Four-Step Debug Process:
- Gather Evidence - Collect error messages, console logs, and network requests
- Isolate the Problem - Identify the specific component, function, or interaction causing issues
- Provide Context - Document the environment, data state, and user actions that trigger the problem
- Test Systematically - Make incremental changes with rollback capability
This structured approach ensures you don't waste time on symptoms while missing the root cause. Start with evidence, not assumptions.
Debug Workflow Example:
3. Checking for errors in Shakespeare
Shakespeare now has the ability to see console errors directly! When you're experiencing issues with your project, the first step is to check for errors using Shakespeare's built-in debugging tools. This saves you time and provides immediate insight into what's going wrong.
How to check for errors in Shakespeare:
- Look for the bug icon: In the top right of the preview pane, you'll see a bug icon. Click it to view console errors.
- Review the errors: Any JavaScript errors, warnings, or console messages will be displayed
- Copy and paste: You can copy these errors and paste them directly into the chat with Shakespeare
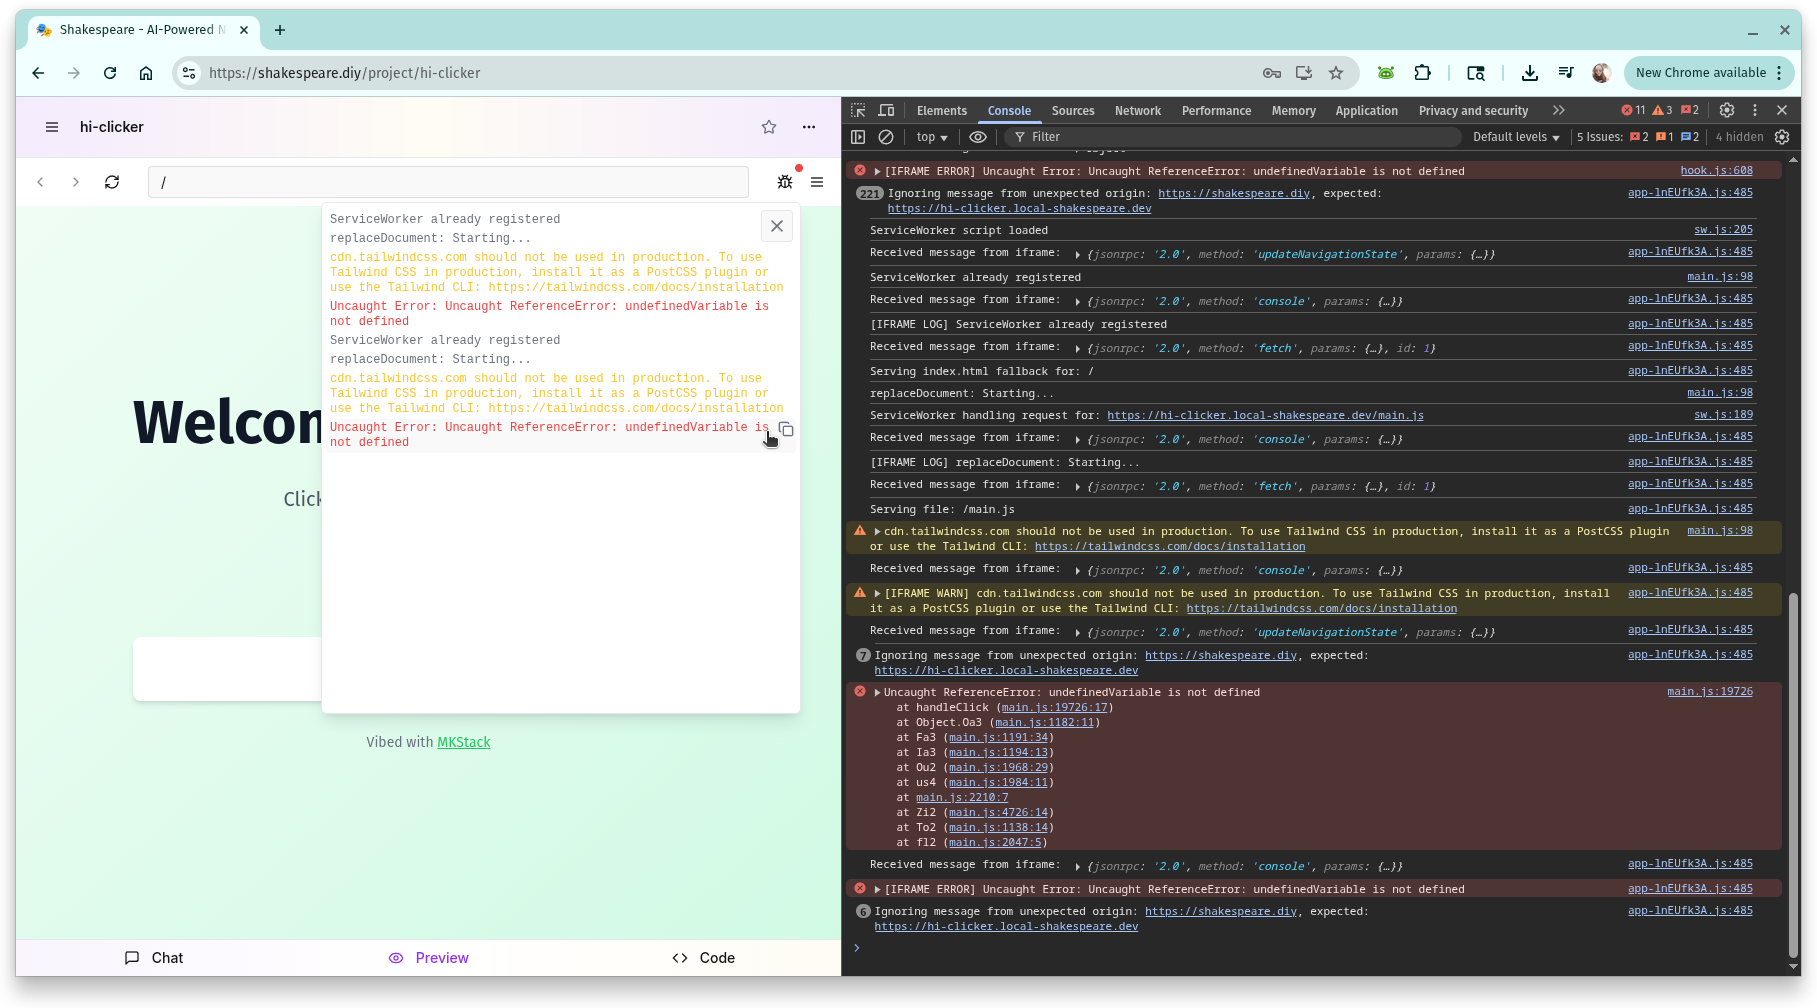
The bug icon in the top right of the preview pane gives you instant access to console errors.
Meet Quilly, the Shakespeare mascot! From time to time, you may see Quilly pop up with useful information about various errors. We're still working to improve this feature, but it's a great way to get quick tips and context when Shakespeare detects common issues.
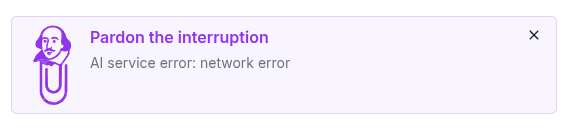
Quilly provides helpful tips and error messages.
💡 Pro Tip
Always check the console errors first! Many issues can be quickly identified and resolved by copying the error messages directly into your chat with Shakespeare. This is much faster than describing symptoms.
4. Opening Developer Tools
Developer tools are your debugging microscope. Every modern browser includes powerful debugging capabilities that reveal what's happening behind the scenes in your Shakespeare application.
Quick Access Methods (Desktop Only):
- Chrome/Edge: Press F12 or Ctrl+Shift+I (Windows/Linux) / Cmd+Option+I (Mac)
- Firefox: Press F12 or Ctrl+Shift+I (Windows/Linux) / Cmd+Option+I (Mac)
- Safari: Press Cmd+Option+I (Mac) - Enable Developer menu first in Preferences
- Alternative: Right-click on page → "Inspect" or "Inspect Element"
Essential DevTools Tabs:
- Console: Error messages, warnings, and custom log output
- Network: API requests, response codes, and loading times
- Elements: HTML structure and CSS styling inspection
- Sources: JavaScript debugging with breakpoints
- Performance: Load times, memory usage, and rendering analysis
5. Gathering Essential Evidence
Good debugging starts with thorough evidence collection. The more specific information you provide to Shakespeare, the more targeted and effective the solutions will be.
Critical Information to Collect:
- Console Output: Copy exact error messages, warnings, and stack traces
- Browser DevTools: Network tab failures, React DevTools component state
- User Journey: Step-by-step actions that trigger the issue
- Environment Details: Browser version, screen size, data conditions
- Expected vs. Actual: What should happen vs. what actually happens
Document the reproduction steps clearly. If you can't reliably reproduce the issue, Shakespeare can't reliably fix it.
Good Evidence Example:
"User registration form fails on submit. Steps: 1) Fill email field with 'test@example.com' 2) Fill password with 'password123' 3) Click 'Sign Up' button. Expected: Success message and redirect to dashboard. Actual: Form resets, no error message shown. Console shows no errors. Network tab shows no requests sent. Tested in Chrome 118 on Windows 11, 1920x1080 screen."
6. Console Error Debugging
Console errors are your first clue. Most JavaScript issues surface in the browser console with specific error messages that point directly to the problem. When reporting console errors to Shakespeare, copy/paste the entire console output to Shakespeare.
Console Error Debugging Example:
"The submit button isn't working. Console shows: 'TypeError: Cannot read properties of undefined (reading 'email')' at line 47 in ContactForm.jsx. This happens when I click submit after filling out the form. Expected: form should submit and show success message. Actual: nothing happens and error appears. The error occurs in the handleSubmit function when trying to access formData.email."
💡 Pro Tip
The AI will often add console.log messages to help you debug. If you see these, include them in your report to Shakespeare as they provide additional context about variable states leading up to the error. Don't forget to ask them to be removed after!
7. Debugging Nostr Events
Nostr applications require specialized debugging techniques. When building decentralized applications with Shakespeare, you need to understand what events are being created, signed, and broadcast to the network.
Essential Nostr Debugging Tools:
- Alby Extension (Paranoid Mode): Review every event before signing and broadcasting
- Nostr DevTools: Browser extensions that show real-time event streams
- Relay Logs: Monitor which relays accept or reject your events
- Event Validation: Verify event structure, signatures, and required fields
- Network Inspection: Track WebSocket connections to Nostr relays
Use Alby's paranoid mode during development to see exactly what events your application creates before they're sent to relays. This prevents broadcasting malformed or test events to the live network.
🔧 Enabling Alby Paranoid Mode:
Common Nostr Event Issues:
- Invalid Event Structure: Missing required fields (id, pubkey, created_at, kind, tags, content, sig)
- Incorrect Event Kind: Using wrong kind number for the intended functionality
- Malformed Tags: Invalid tag arrays or missing required tag elements
- Signature Problems: Events not properly signed or signature verification failures
- Relay Rejection: Events rejected by relays due to policy or validation issues
Nostr Event Debugging Example:
"User profile updates aren't saving. Alby paranoid mode shows this event being created: {"id":"abc123","pubkey":"user_pubkey","created_at":1694123456,"kind":0,"tags":[],"content":"{\"name\":\"John\",\"about\":\"Developer\"}","sig":"signature"}. Event structure looks correct for kind 0 (user metadata). Network tab shows WebSocket connection to relay successful. Need to check if relay is accepting the event or if there's a validation issue with the content format."
Advanced Nostr Debugging Techniques:
- Event Validation: Use nostr-tools library to validate event structure before signing
- Relay Testing: Test events against multiple relays to identify relay-specific issues
- Event History: Track event creation, signing, and broadcast timeline
- Tag Analysis: Verify tag arrays contain correct references (e tags, p tags, etc.)
- Content Inspection: Ensure event content is properly formatted JSON when required
💡 Pro Nostr Debugging Tip
When reporting Nostr issues to Shakespeare, always include the complete event JSON from Alby's paranoid mode. This shows the exact data structure being created, making it much easier to identify formatting, validation, or relay compatibility issues.
Complete Nostr Debugging Report Example:
"Direct messages not sending between users. Alby shows event: {"kind":4,"tags":[["p","recipient_pubkey"]],"content":"encrypted_content_here","created_at":1694123456}. Event structure appears correct for kind 4 (encrypted DM). WebSocket shows successful connection to 3 relays. Issue: recipient not receiving messages. Suspect: encryption/decryption mismatch or relay propagation delay. Need to verify NIP-04 encryption implementation and test with different relay sets."
8. Advanced: Meta-Debugging
Meta-debugging is debugging your debugging process. When regular debugging techniques aren't working, or when you've spent too many credits without progress, it's time to step back and analyze your approach itself.
Meta-debugging involves asking Shakespeare to examine your debugging strategy, identify patterns in failed attempts, and suggest more efficient approaches. This is particularly powerful because Shakespeare can review your entire chat history and spot inefficiencies you might miss.
Forward Meta-Debugging: When You're Stuck
Use this when a bug persists despite multiple fix attempts. Instead of trying yet another random solution, ask Shakespeare to analyze what you've already tried and create a systematic plan.
Forward Meta-Debugging Example:
"This authentication bug has persisted despite multiple attempts to fix it. We've tried: 1) Updating the JWT token handling, 2) Fixing the login form validation, 3) Modifying the API endpoint response. The user still can't stay logged in after page refresh. Perform an analysis of what we've already tried and create a new systematic plan to resolve this bug. What are we missing?"
Key phrases for forward meta-debugging:
- "Analyze what we've already tried and create a new plan"
- "What patterns do you see in our failed attempts?"
- "What fundamental assumption might we be missing?"
- "Create a systematic debugging plan based on our chat history"
Reverse Meta-Debugging: Learning from Inefficiency
Use this after solving a particularly bug to improve your future debugging skills. Ask Shakespeare to review your debugging session and identify how you could have been more efficient.
Reverse Meta-Debugging Example:
"I spent way too many credits trying to solve this form validation bug. We eventually fixed it, but it took 20 messages when it probably should have taken 5. Analyze our chat history and tell me: 1) What information should I have provided earlier? 2) Which debugging steps were unnecessary? 3) How can I be more efficient debugging similar issues next time?"
Key phrases for reverse meta-debugging:
- "Analyze our chat and tell me how I can be more efficient next time"
- "What should I have provided earlier to solve this faster?"
- "Which steps in our debugging process were unnecessary?"
- "What debugging pattern should I follow for similar issues?"
Starting Fresh: When to Clear the Chat
Sometimes the best debugging move is to start over. When the AI seems to be spinning its wheels or the cost per prompt is getting too high, it may be time to clear the chat or start a new conversation.
Signs you should start a new chat:
- Circular reasoning: The AI keeps suggesting the same solutions despite them not working
- Context overload: The conversation has become so long that each prompt is expensive
- Lost focus: The debugging session has strayed far from the original issue
- Multiple failed approaches: You've tried many different solutions without progress
How to start a new chat in Shakespeare:
- Click on the 3 dots action overflow menu
- Choose "New Chat"
How to effectively start fresh: Before clearing the chat, document what you've learned, what you've tried, and what the current state is. When starting a new chat, provide a concise summary of the issue and what approaches have already failed. This prevents the AI from repeating unsuccessful attempts.
Starting Fresh Example:
"Starting a new chat because the previous conversation got too long and costly. Summary: Working on a bug where published Nostr events (kind 1 notes) aren't appearing in the feed. Already tried: 1) Verifying event structure and signature validation, 2) Testing different relay configurations, 3) Checking WebSocket connection status, 4) Adjusting event filters and subscription queries. All failed. Current state: Events publish successfully (verified in Alby paranoid mode), relays accept them (200 OK responses), but they don't appear in the user's feed. Please help debug this with fresh eyes, avoiding the approaches we've already tested."
When to Use Meta-Debugging
Debugging is a skill that improves with practice. The more systematically you approach problems, the faster you'll identify solutions. Remember: Shakespeare can only help you as effectively as you can describe the problem. Master these debugging techniques, and you'll transform from someone who gets stuck on issues to someone who solves them quickly and confidently.
Want to Learn Better Prompting?
Master the fundamentals of effective prompting to build better projects with Shakespeare.
Get the latest Shakespeare updates and resources
Stay updated with the latest features and announcements. Optionally provide your npub to link your account.
Soapbox is funded by grants and donations, not ads or data sales.
Everything we build is open source and belongs to the community. Help us keep it that way.